Help for ADD/ADHD
Children with ADD or ADHD are special kids. They can be wonderfully spontaneous, creative, and enthusiastic about life. But, when it comes time to focus that enthusiasm, these children are sometimes challenged beyond their abilities. Attention-Deficit/Hyperactivity Disorder (ADHD) is one of the most common neurodevelopmental disorders diagnosed among children, and often continues well into adulthood. An estimated 6% of children meet the criteria for ADHD. ADHD symptoms may not include hyperactivity and primarily reflect inattention (often referred to as ADD). ADHD may include impulsivity and hyperactivity. ADHD comes in three types: inattentive type, hyperactive-impulsive type, and combined type.
ADHD is often treated with medications, such as stimulants. These drugs may improve symptoms soon after they are taken and tend to wear off hours later. Neurofeedback has been found to be an effective non-medication treatment for ADHD, providing a long-term benefit. For example, a key study (Monastra, 2002) found that kids treated with Ritalin and neurofeedback showed improvement in computerized attention measures after the Ritalin was discontinued at a one year follow up. Attention measures of children treated with Ritalin without neurofeedback returned to pre-treatment levels after the medication was discontinued.
A recently published meta analysis by an international team of neuroscientists (Doren et al, 2019) demonstrated the lasting effects of neurofeedback for ADHD compared to medication. While both medication and neurofeedback improved symptoms during treatment, when both were discontinued only neurofeedback showed lasting effects.
ADHD is the most researched application of neurofeedback. To date, 261 studies on neurofeedback for ADHD have been published in scholarly, peer-reviewed journals, as indexed in PubMed.
QEEG studies can reveal the markers for ADHD in the brain. Primary markers include slowing of activity in the frontal lobes. Another marker is when there is too much arousal in the brain. These different brain characteristics may account for the differences in how drugs may affect individuals, such as when there is a negative effect from stimulants. Neurofeedback targets the specific areas of the brain and the specific brainwave frequencies involved. Once the treatment is completed (20-40 sessions), a long-term benefit is usually achieved. Results vary, of course, but typically involve moderate to strong symptom improvement.
The first step is to conduct a Quantitative EEG (QEEG) to see if your child’s brain reflects the specific markers for your child’s symptoms. A treatment plan is then developed to address these symptoms in the most effective way with neurofeedback, parenting strategies and behavioral therapy. Symptom measures are also taken from time to time, and session-to-session progress is calculated. If you child is currently on medication, neurofeedback is still an option.
To get started, contact us.
Meds not working?
Medication can be a real life saver, making life worth living. But, not all of life’s problems can be cured with a drug. Problematic side effects can be unmanageable. In some cases the medication has no significant benefit. It may be addictive. And, recent research indicates that some medications used for ADD/ADHD and anxiety can have long-term adverse effects.1, 2, 3, 4
For some, medication may have a benefit–though limited. Many disorders require a combination of treatments to achieve a satisfactory improvement. Many of our clients are prescribed psychstimulants for ADD/ADHD, or antidepressants for anxiety, depression or PTSD.
We work in cooperation with prescribing physicians in order to maximize the benefits clients may receive from treatment. We provide a variety of treatment modalities which may supplement the effects of medications, and that provide benefits on their own–without medication.
As one example, Dr. Jones’ research at UTSA has affirmed the use of neurofeedback as an effective treatment for anxiety symptoms.5 By assessing the particular markers of a client’s brainwaves and physiological stress responses, we use a multifaceted approach to anxiety symptoms, as well as similar symptoms found with PTSD.
The first step is to conduct a Quantitative EEG (QEEG) to see if your brain reflects the specific markers for your symptoms. We also assess for physical markers of an excess stress response–which can be treated with various forms of biofeedback and counseling therapies. A treatment plan is then developed to address your symptoms in a way that is most suited to you. Unlike some medications, we are able to specifically target brain areas and brain waves most related with your symptoms.
1ADHD May Increase Risk of Parkinsons Disease and Similar Disorders, University of Utah Health, 09/12/2018
2ADHD Medications: Are ADHD Drugs Right for You or Your Child?, HelpGuide, 10/2018
3Benzodiazepine use may raise risk of Alzheimer’s disease, Harvard Health Blog, 12/13/2016
4Management of benzodiazepine misuse and dependence, Australian Prescriber, 10/2015
5QEEG Guided Neurofeedback Treatment for Anxiety Symptoms, Neuroregulation, 09/29/2018
Can’t quit?
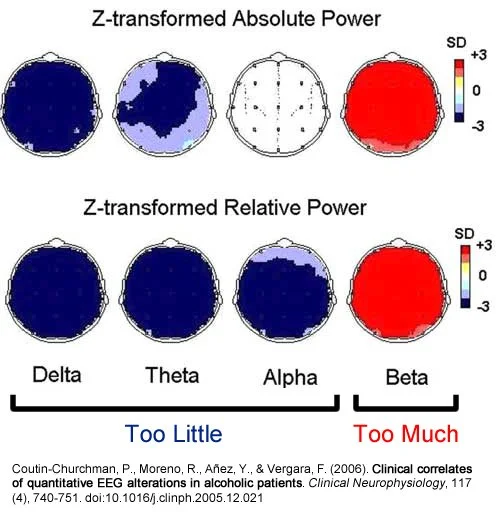
Wanting to quit, but can’t? We start where you can’t stop. Using a combination of medical consultation, biofeedback, neurofeedback (EEG biofeedback), and cognitive behavioral therapy, we get at the underlying causes of addiction. Research has shown that brainwave patterns may reflect characteristics common to alcohol abuse, alcoholism, and poly-substance abuse or addiction. These are patterns that provide insight into a person’s “drug of choice” or the “mood altering drug” used to self-medicate the emotional distress you may be experiencing.
For example, research shows that the brains of alcoholics tend to be overaroused with too much fast activity (anxiety, agitation, irritability) and too little of the types of brainwaves that help us remain focused, calm, and able to de-stress. By training brainwaves toward more normal functioning, what Dr. Jones calls “meditation on steroids,” the underlying cause can be addressed.
The first step is to conduct a Quantitative EEG (QEEG) to see if your brain reflects the specific markers for abuse and/or addiction. We also assess for physical markers of an excess stress response–which can be treated with various forms of biofeedback and cognitive behavioral therapy. Our program of treatment is done in our office. Bear in mind, however, that alcohol and/or substance abuse can affect your health. We will want you to consult with a physician as part of the assessment process.
A Brief History of Neurofeedback
The First Recorded Human EEG
In 1926, Hans Berger developed one of the first devices to record an EEG. The device virtually filled a room and made a rudimentary recording. It was known that the brain produces electrical signals in an oscillating wave form, though the process was not clearly understood.
Berger. among others, paved the way for more sophisticated means of recording the EEG and therefore a deeper understanding of the underlying neuronal processes that produce these wave forms. From the outset, it was known that a person could learn to exercise some level of control over the waveform being produced in real time. So, in essence, even the first EEG devices were biofeedback devices since the immediate feedback of the visual EEG recording enabled a person to gain voluntary control over their brain’s neuronal waveforms.
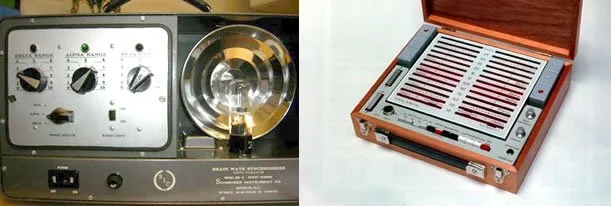
By the 1960’s, numerous portable devices for neurofeedback had been developed, including the Brain Wave Synchronizer (1958) and the Mind Mirror (early 1980’s).
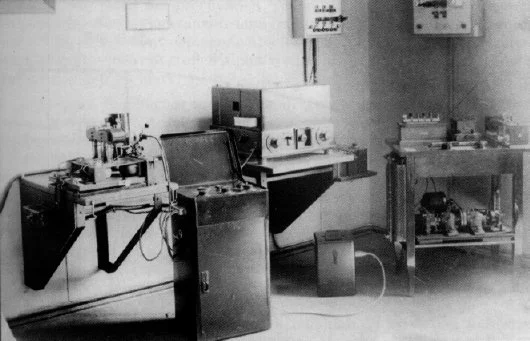
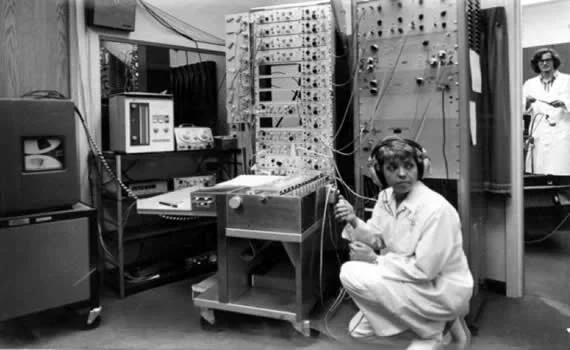
Doctoral candidate Penny Montgomery with her first biofeedback machine at the University of Texas Health Science Center in San Antonio, 1969.
Current neurofeedback devices are computer based. Various companies produce software which enables the use of EEG amplifiers to provide neurofeedback. Rather than looking at a strobe (as used on the Brain Wave Synchronizer) or a set of illuminated bars (as on the Mind Mirror), persons doing neurofeedback today can chose from a wide selection of feedback options, including animations, games and even DVDs.
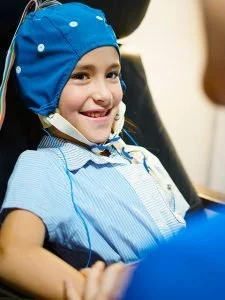
This young woman in my office is controlling a space ship as she trains her brain to become more attentive. Visible also is my control screen, showing the raw EEG signal and various frequency bands produced by the software.
Cats Can Meditate
For some time, the therapeutic use of the EEG was virtually nil. In the sixties, however, Joe Kamiya at the University of Chicago experimented with a rudimentary neurofeedback device which enabled people to train their brains to go into an alpha pattern, which is associated with a calm, clear, meditative state. This was a significant breakthrough. Unfortunately, neurofeedback lost much of its scientific status as it became associated with a number of guru types who promoted similar devices as an avenue to deeper consciousness.
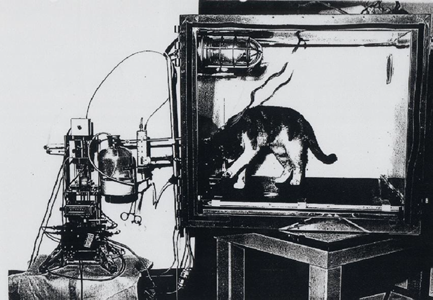
The discovery that neurofeedback can have therapeutic benefits may have been an accidental one. Barry Sterman, a researcher at UCLA, was experimenting with cats to see if they could learn to control their brainwaves using an implanted lead, an electronic box, and a food dispenser which rewarded the cats when their brains produced more amplitude in a certain frequency range. Meanwhile, NASA had concerns about the health of their Mercury astronauts while in orbit and suspected that a toxic rocket fuel chemical was leaking into their capsules, which could cause nausea and seizures. To study the effect of this chemical, Sterman conducted experiments on cats, some of which he’d trained with neurofeedback. Sterman’s data clearly shows that the cats previously trained with neurofeedback were resistent to the effects of the chemical and were less likely to have seizures. Sterman later found that neurofeedback training was helpful to humans with epilepsy.
Research on neurofeedback was also done during the 70s by Joel Lubar at the University of Tennessee. Lubar found neurofeedback to be helpful in treating ADHD, expecially the hyperactive component. In the 80s, Eugene Peniston treated alcoholics in a VA treatment center with neurofeedback and followed them for some time afterwards. After 5 years, 70% of the participants remained abstinent of alcohol.
Since these developmental years, neurofeedback has become a commonplace form of treatment with burgeoning levels of research.
Quantitative EEG (QEEG)
Dr. Jones is a regionally recognized specialist in QEEG-guided neurofeedback and his services are used at the hospital, medical clinic, university, research and practitioner levels. A Quantitative EEG (QEEG) provides a wealth of information about the brain’s functioning and is key to identifying unique markers of brain activity that correspond with symptoms.
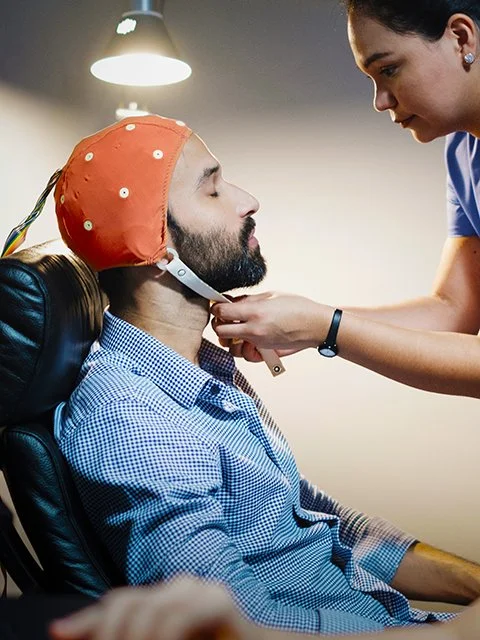
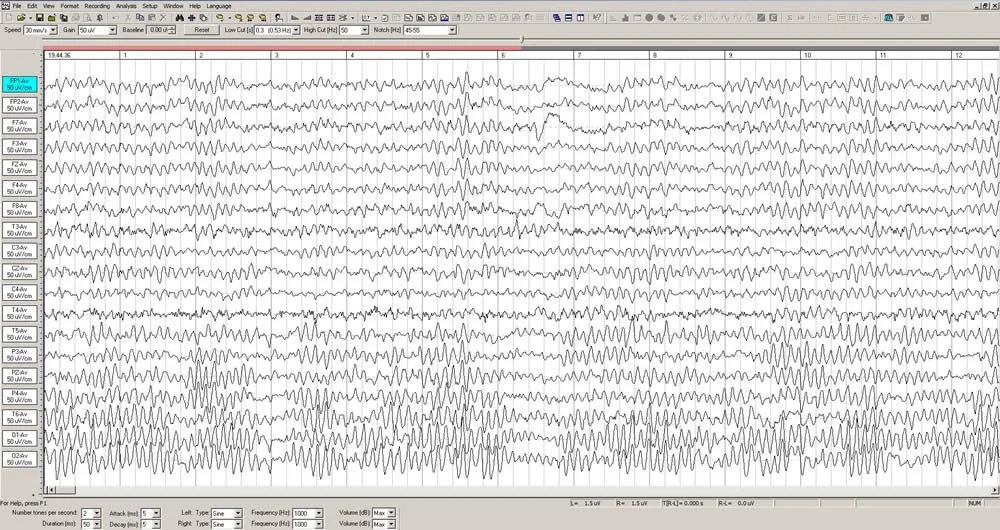
The process begins with a 19 channel EEG recording done in the office. This requires the use of an electrode cap and careful procedures to insure that the quality of the recording is sufficient.
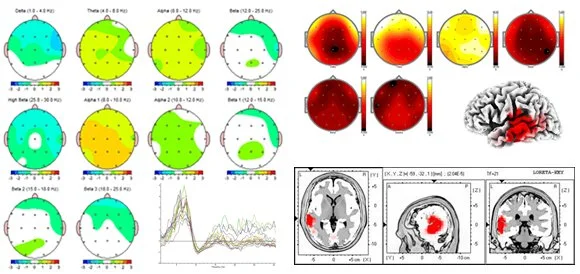
The recording is thoroughly inspected for characteristics, and appropriate selections are made for further processing. Quantitative analysis of the EEG requires special software and normative databases. The analysis is depicted in brain maps, spectra, and 3-D localization of activity.
The QEEG is then reviewed in light of the client’s symptoms and a treatment plan is created.
Why I don’t use automated QEEG report generators
By Mark S. Jones
Neurofeedback can be a powerful and effective form of treatment for many problems, if done correctly. Many neurofeedback practitioners use automated report generators to process quantitative electroencephalograms (QEEGs). These generators come in the form of software that the clinician uses in their office, or by online services that do automated processing. Unfortunately, no matter how sophisticated these programs may be, they cannot replace the trained eye of someone who first examines the raw EEG. Nor can they replace the diagnostic ability of a trained clinician to assess the client’s symptoms and develop a proper treatment plan to address those symptoms.
Let’s look at an example of an automated report of an adult who presented with obsessive-compulsive behaviors and anxiety. This person also complained of insomnia and various cognitive problems, such as attention and short-term memory. An EEG recording was done by another neurofeedback practitioner and processed through an automated report generator that is probably one of the most sophisticated generators on the market today. In general, this analysis shows problems typically found with these reports: (1) reference pollution, (2) artifact treated as brain wave activity, and (3) not identifying research-based markers for certain relevant symptoms. The results include misdiagnosis and incorrect treatment protocols. These issues underscore the need for training and skill in making psychological assessments, reading the EEG, and understanding the limitations of QEEG findings.
Reference pollution
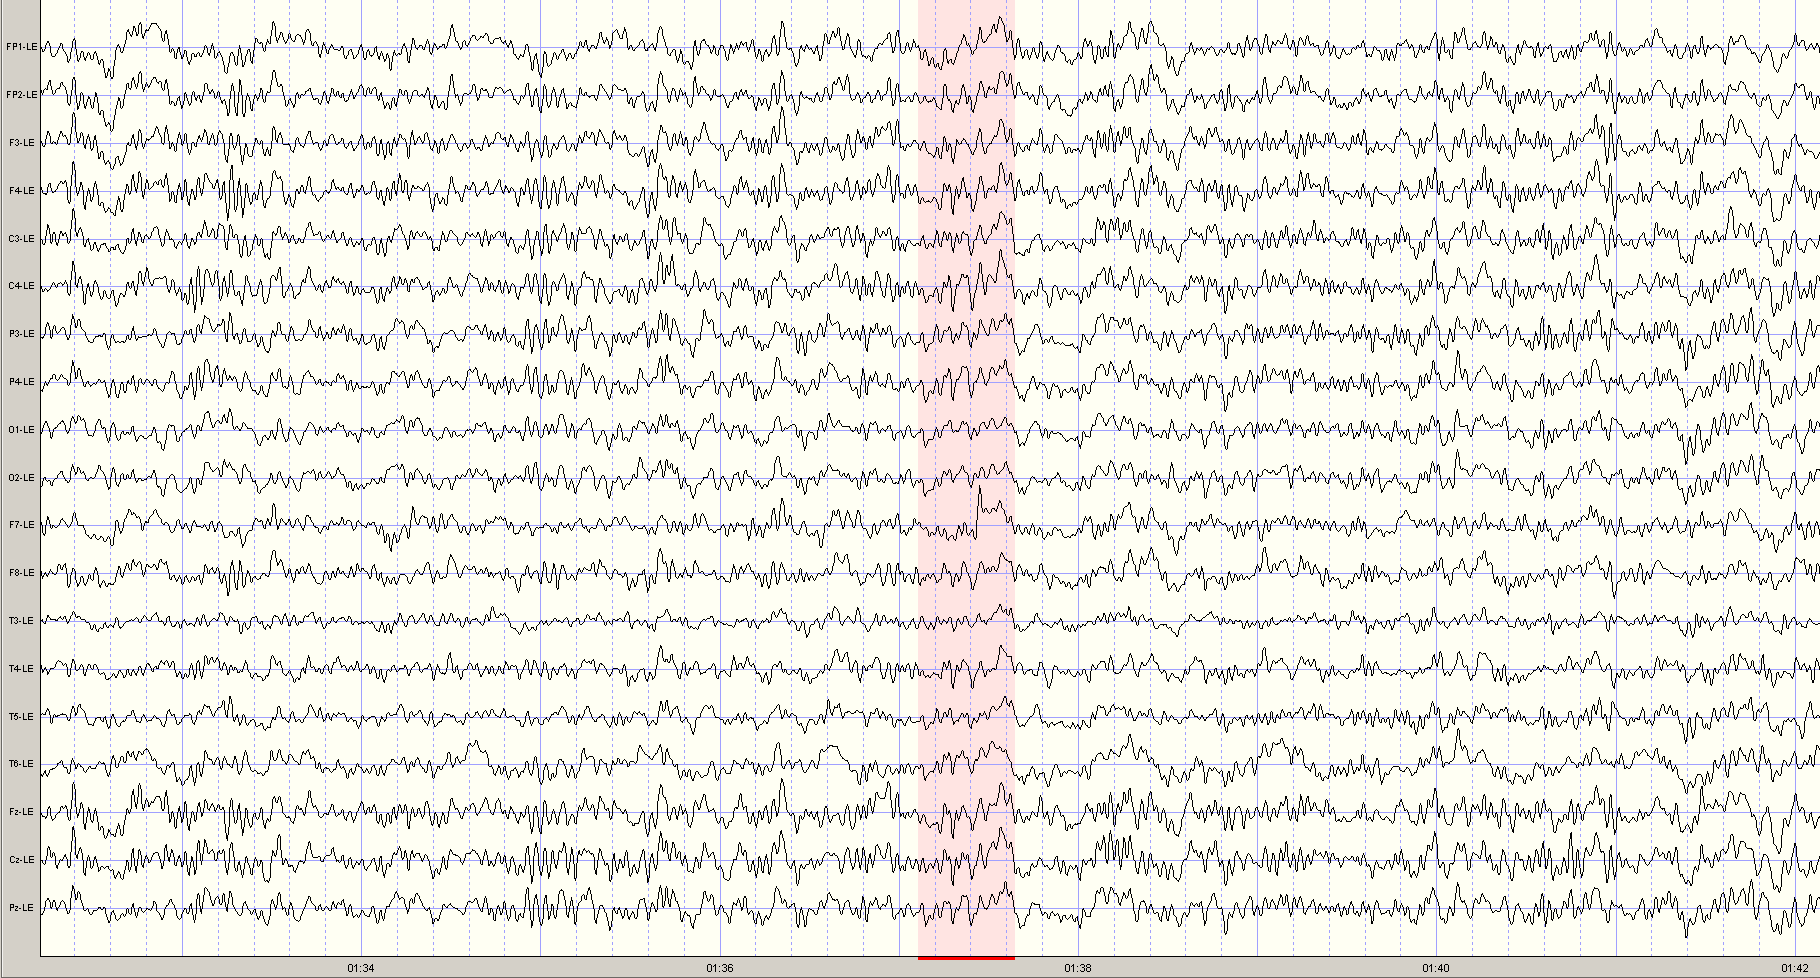
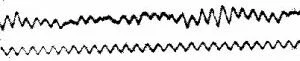
The montage used to process the EEG was Linked Ears, where all scalp electrode signals are compared to electrodes placed on the ear lobes or mastoids. A significant percentage of people, however, have measureable brain wave activity at the ear lobes which often originates from the medial and posterior temporal lobes in the brain. If brain wave activity is present in the reference electrodes, then all of the scalp electrode channels are polluted with this signal and will likely give a false reading of the location of these signals. One tell-tale sign of reference pollution is the appearance of wave oscillations that peak simultaneously in all channels. Actual brain waves do not appear in this manner. See the shaded area in the tracings below and observe the larger wave forms (alpha) that all peak simultaneously. One result is that certain brain waves may look more widespread that they are.
Automated report generators are simply not able to distinguish between reference pollution and actual brain waves patterns. The following excerpt is taken from an actual report produced by an automatic report generator, from the same section of the EEG recording.
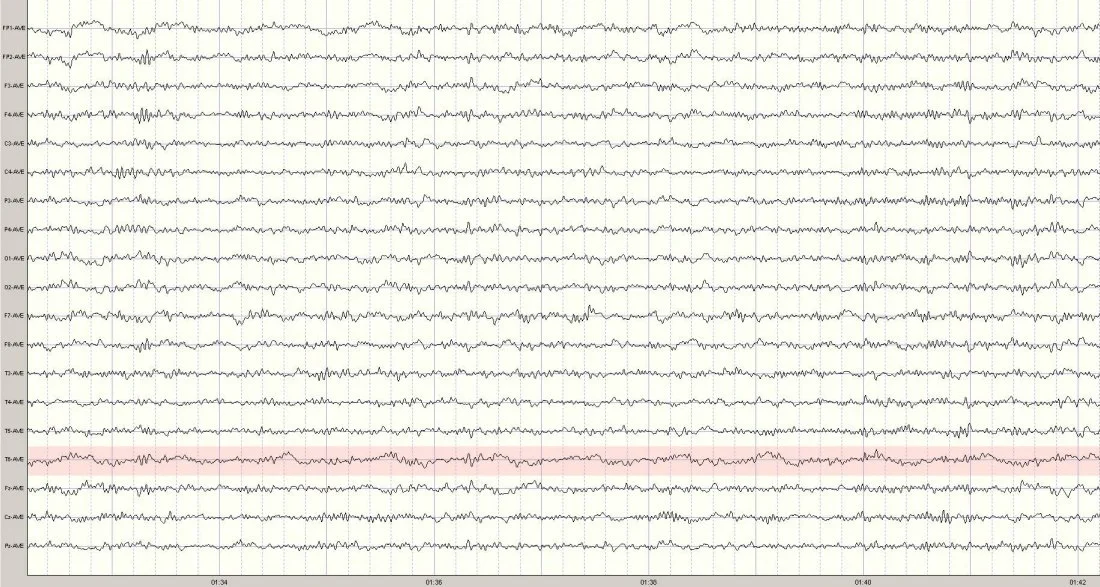
By using a different montage that does not use ear lobe references, a more accurate picture of true brain wave activity is revealed.
Artifact treated as brain activity
Artifact is any signal in the EEG that is not caused by brain activity, such as muscle tension, head movement, eye movement, swallowing, or heart beats. In this EEG, there is a distinct heart beat artifact in the T6 channel (above and behind the right ear). This particular artifact is referred to a cardio-ballistic or pulse artifact, and results from the expansion of a blood vessel due to heart beats which causes the effected electrode to move slightly and produces a slow up-and-down motion on the EEG tracing for that channel. See the example from this same segment of EEG:
Unless this artifact is recognized by the clinician, it may well be mistaken as an abnormal brain wave and treated as such. In the automatic report generator, the artifact is visible in the topographic maps.
Unfortunately, the artifact also became a part of the treatment recommendations:
Does the clinician really want to attempt a protocol that is suppressing the client’s heart beat?
Additionally, it is also possible that the ear reference pollution distorted the coherence measures at T4, resulting in the questionable protocol (#3) above. Notice that the protocols are based on a linked ears montage, which in this case is polluted with artifact.
What is missing
A trained and experienced clinician would examine the EEG record and QEEG results to determine what brain wave abnormalities might be associated with the client’s symptoms. In this case there are two markers for anxiety and obsessive-compulsiveness: (1) beta spindles, and (2) attenuated alpha.
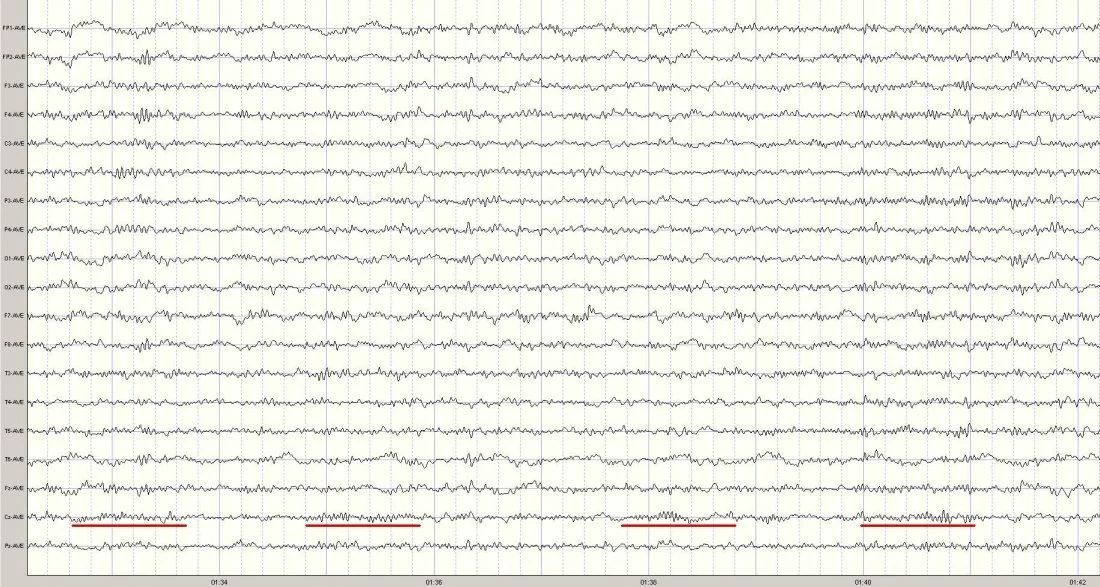
To the trained eye, the beta spindles are seen in the central region, centered at Cz. Examples are underlined in the EEG segment below.
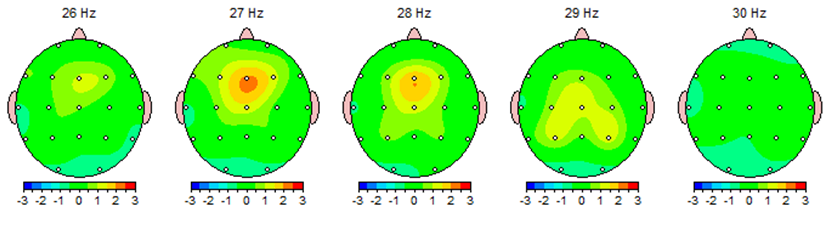
This beta spindling activity is also depicted in the topographical maps and is most prominent at 27 cycles per second.
The shape of the waveform (spindling) reminded early electroencephalographers of a sewing spindle of thread. Automated report generators do not have the capacity to analyze brain waveforms (or morphology) for these types of research-supported biomarkers. The amplitude of this activity is statistically significant enough in this case to show up on the topographical maps and the protocol list, the treatment recommended is less than optimal. You will notice that the frequency of the waveform varies from 26-29hz. But, since only the 27hz activity exceeded the statistical model of the automated report generator, training was recommended only at that frequency, and would deny the client the benefit of training the entire frequency band of 26-28hz. Furthermore, while the amplitude of the waveform is highest at Fz, the tracings shown above show that the duration of the spindling activity is longest at Cz. Perhaps selecting a location between these two sites might be a better option.
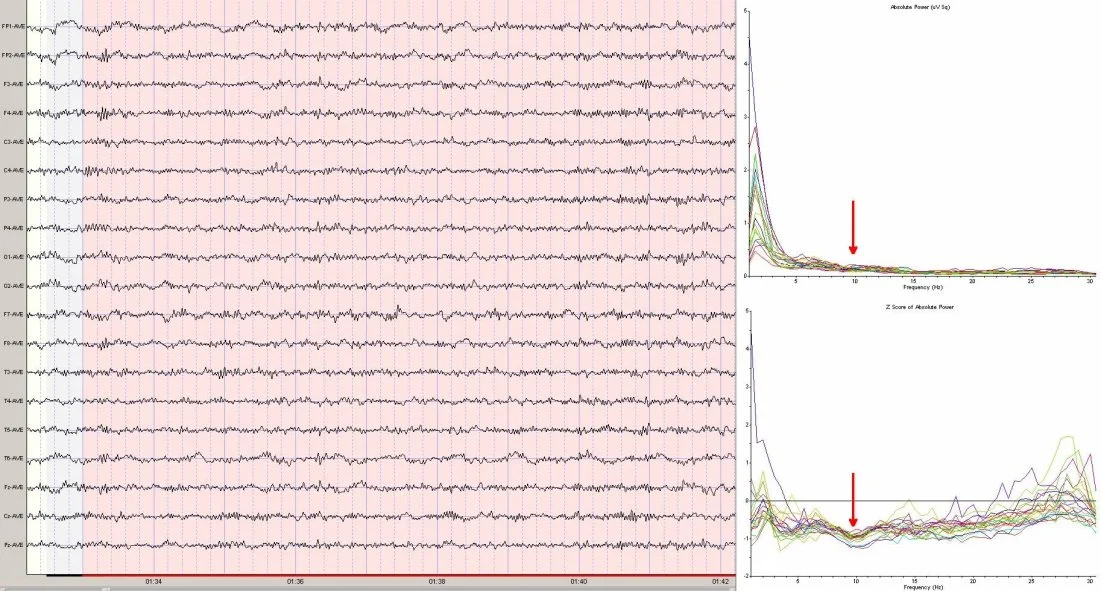
What is missing from the record is any organized, dominant alpha pattern—normally seen during an eyes closed recording. For adults, the alpha peak frequency is normally around 10hz. The following spectra graphs show where the alpha peak would be, if it were present. Additionally, the Z score (statistical) spectra graph shows a dip instead of a peak, further accentuating the absence of a normal alpha pattern.
Attenuated alpha has been shown to be associated with anxiety in some persons, and may be a marker for emotional trauma. However, the automated report fails to register this pattern. No protocol is recommended by the report for addressing this issue. Eyes closed, posterior alpha training has been found to be helpful for these individuals.
When taken as a whole, the spectra depicts an EEG that may be considered of low amplitude and fast in frequency, yet another marker for cortical overarousal, such as is often seen with persons who have anxiety and obsessive-compulsive tendencies. Since persons with these symptoms often complain of sleep and attention problems, it is likely that with improvement in the obsessive-compulsive and anxiety symptoms, the other issues would improve as well.